Summary
- For established businesses, dividends and earnings per share (EPS) growth are the primary drivers of total returns on share investments.
- P/E ratios, or more specifically, changes in P/E ratios, are merely ups and downs in sentiment, along the road to the end of the investment journey.
- Please let me explain why this knowledge is of importance to young and old investors alike.
- Looking for more investing ideas like this one? Get them exclusively at Dividend Growth Income+ Club. Get started today »
Understanding The Dividend Growth Income+ Club Approach
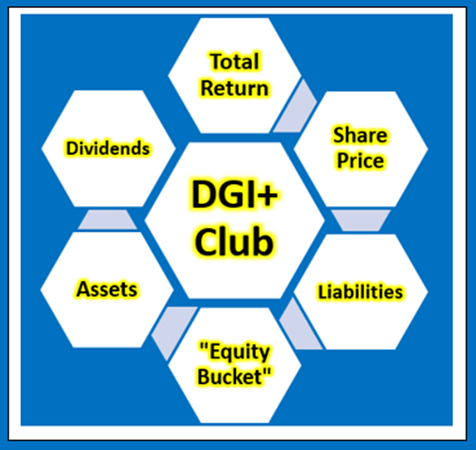
Total Return, Dividends, Share Price
The only way an investor can achieve a positive return on an investment in shares is through receipt of dividends and/or an increase in the share price above the buy price - the only way.
Johnson & Johnson Investment Review: Short-term Outlook To End Of 2022
I recently conducted a review of the four pharma companies in the DGI+ Club database of 127 tickers, including Johnson & Johnson (JNJ). The stocks in the database are all dividend payers and include the dividend aristocrats. These are all quality stocks and reviews are concentrated on identifying those stocks likely to provide superior returns due to share mispricing as a result of current distortion to market metrics.
At current share price levels, Johnson & Johnson, with potential for up to low double-digit returns, appears to offer good value with little downside risk, for investment through the end of 2022. However, it does not offer the extra high level of returns we are seeking in a market where we believe there is considerable mispricing of stocks at this time, due to COVID-19 disruption of businesses. Summarized in Tables 1.1 and 1.2 below is relevant data on historical and projected performance for Johnson & Johnson.
Johnson & Johnson Investment Review: Long-term Outlook 10, 20, 30, 40 Years From Now
In my article of June 20, 2013, "Johnson & Johnson: Last 7 Years' Earnings More Than Previous 107 Years," I marveled at how Johnson & Johnson had consistently grown earnings at ~15% average per year from 1972 to 2006 (note - all readers should be able to link to that article as I have made it an author's pick). With the GFC, there was an interruption to EPS growth for Johnson & Johnson, but the company seems to be again succeeding in accelerating EPS growth. For reasons explained in that article, I do not expect Johnson & Johnson to return to the former 15% average yearly EPS growth rate, but I do illustrate further below, the implications for a young (and possibly not so young) investor, of DRIP investing in Johnson & Johnson, if it could succeed in achieving high single-digit or low double-digit EPS growth rates over the next 10, 20, 30 or 40 years.
Table 1.1 Historical and projected performance
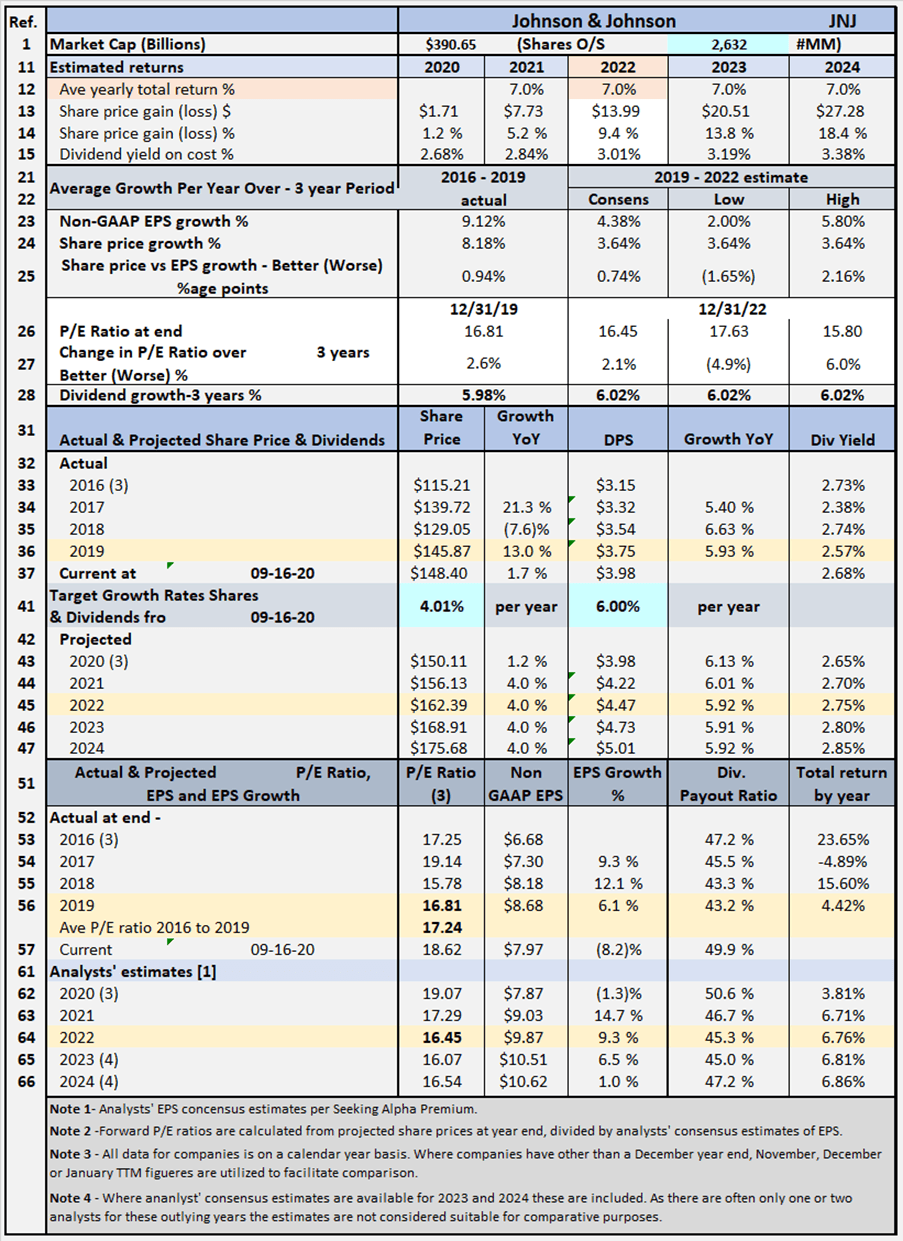
Table 1.1 summarizes historical data from 2016 to 2019 including share prices, P/E ratios, EPS and DPS, and EPS and DPS growth rates. The table also includes estimates out to 2022 for share prices, P/E ratios, EPS and DPS, and EPS and DPS growth rates (note estimates are shown for analysts EPS estimates out to 2024 where available but these are considered not as reliable). Table 1.1 allows modeling for target total rates of return. In the case shown above, the target set for a total rate of return is 7% per year, based on buying on Wednesday, September 16 closing share price level.

