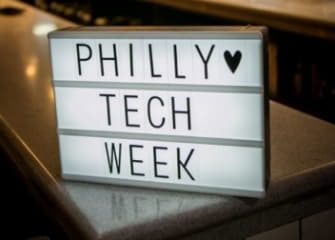
Just look at how many #PTW18 tweets were tweeted during Philly Tech Week 2018 presented by Comcast. Hover over the bubbles and it magnifies the message and image within the tweet. The size of the bubble correlates to how much engagement it received and notes whether it was a retweet or straight from the source. Isn’t it rad to see hashtag results this way instead of the way we’re used to seeing it just written out on a page? We thought so too.
This hashtag reach visual was created by Rosa Torres, a Technical.ly member. Rosa attended our members-only happy hour at our offices back in March and then offered to show us what she means when she promised she could turn our data into “visual inspiration” anytime we wanted, pro bono. (Did I mention our CEO was serving up old-fashioneds?)
READ FULL ARTICLE HERE